“Who let the ‘Doge’ out?”

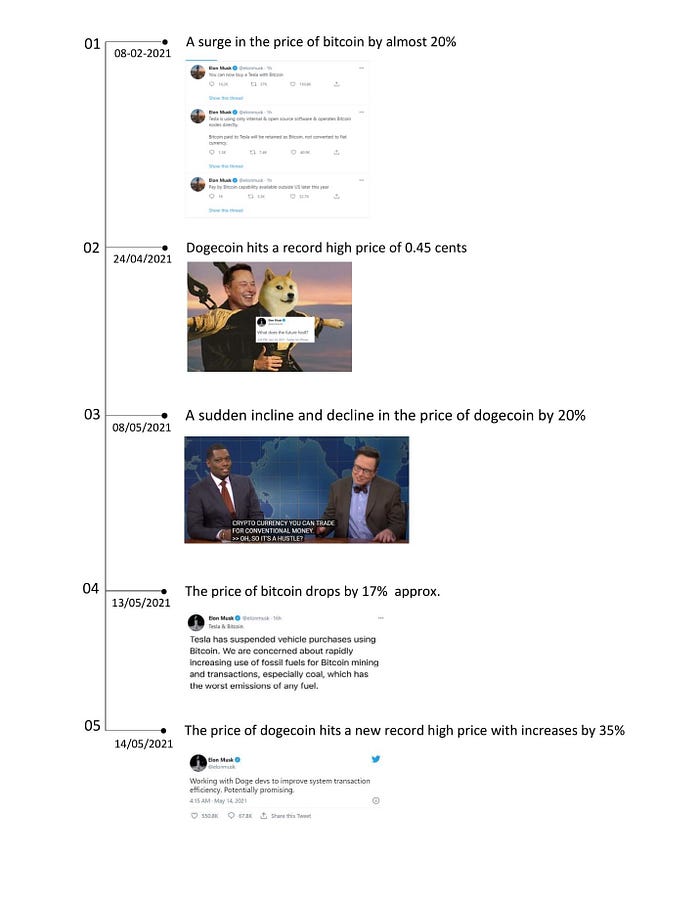
Not long ago(on 08 Feb 2021), we have seen the billionaire, Elon Musk making news about his $1.5B Tesla investment on Bitcoin, which is when it also hit a record high of USD43,000.
Around the same time, Tesla also announced that it would allow vehicle purchases using Bitcoin.
Leave alone the data, seemingly this man can propel and dip the prices of Bitcoin and Doge just by tweeting or talking about them.
Analysis of the Musk effect on Bitcoin & Doge
Lets dive into the analysis on why Elon Musk made such a huge bet and “how doge skyrocketed by 20% in 24 hours and fell another 20% before and after his appearance on Saturday Night Live with Michael Che.
Now that we have a time period we are looking at, lets look at some data.
Data Extraction & Exploration
The data can be extracted from public APIs like cryptowat.ch (REST API documentation for real-time market data: https://docs.cryptowat.ch/rest-api/) as below:


The data extracted here is the OHLC Price data (Open, High, Low and Close Price).
We can also use rapidapi.com (https://rapidapi.com/apidojo/api/investing-cryptocurrency-markets). This requires sign up for API key, Secret key and code generation.
For our analysis, lets use a python package called investpy to retrieve data from Investing.com.
Do a pip install investpy to install the package. Extract the ‘Dogecoin’ and ‘Bitcoin’ OHLC data as below:


Lets look at some line charts of Open, Close values of dogecoin and bitcoins and how Elon Musk’s tweets influenced their prices:
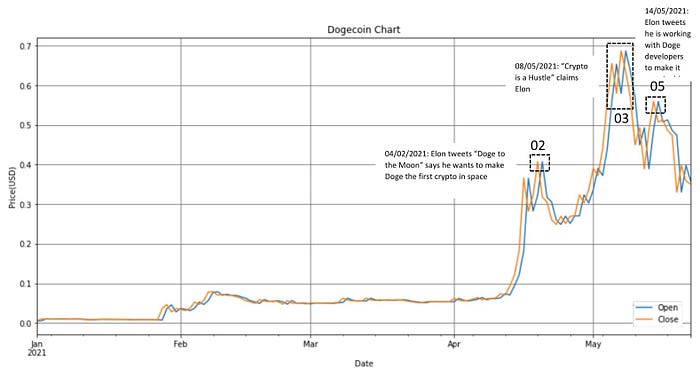
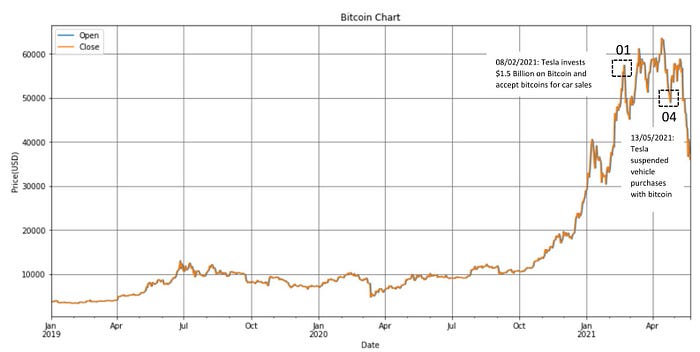
Analysis derived from above charts and relating them to his tweets
Technical Analysis
Lets analyze factors that influenced Elon Musk’s quick decisions that caused the wild price rides in both doge and bitcoin.
Since we are talking about this fall and rise in crypto prices, we should definitely talk about the Bull & Bear markets. Most of us might have come across these terms “bull” or “bear” from Leo D’s The Wolf of Wall Street. While the “Bull market” is characterized by an aggressive market rise , the “Bear market” is characterized by a decline.
Lets look at the candlestick chart for this purpose as they show signs of price direction and momentum. Candlestick charts are characterized by an up and down trend that result in a bearish or bullish engulfing patterns.
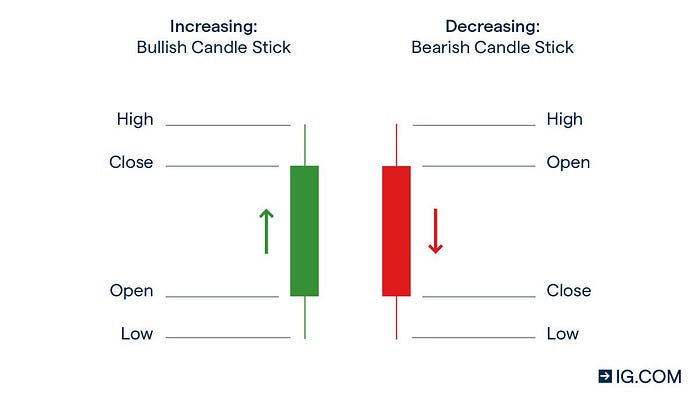
Visit https://www.investopedia.com/trading/candlestick-charting-what-is-it/ to know more about these patterns.
The data being looked at here is from Nov 2020-May 2021:
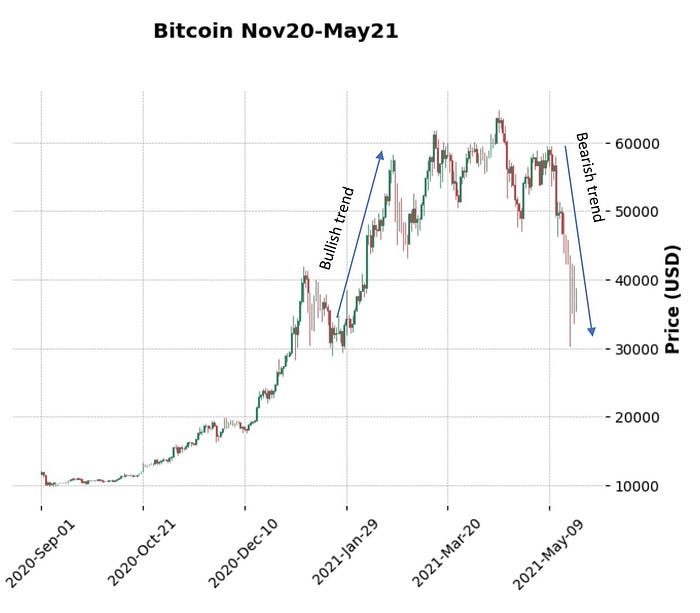
Elon Musk has been the sole reason behind the rallied bullish trend of the bitcoin when he announced his $1.5 billion investment and even caused a bearish trend with the price hitting as low as $30,000 when he withdrew from Bitcoin purchases of Tesla vehicles.
But lets not forget he has helped to stir up a conversation around the heavy carbon footprint of Bitcoin. “Bitcoin consumes more electricity than the entire annual energy consumption of the Netherlands, Cambridge University researchers say” as quoted by cnbc.com
Its one thing to think if the Bitcoin purchases of Tesla’s electric cars will negate the damage in any way.

